
- The number of homes actively for sale increased by 48.3% compared to last year.
- The total number of unsold homes, including homes that are under contract, increased by 6.3% compared to last year.
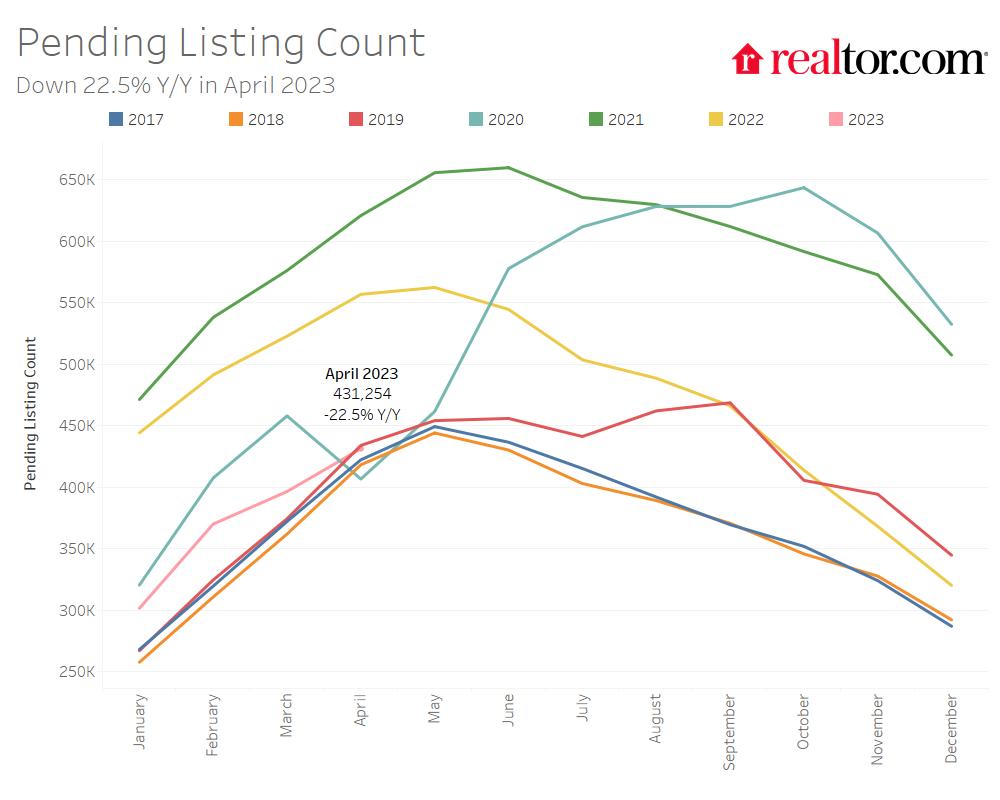
- Home sellers were less active this April, with 21.3% fewer homes being listed for sale compared to last year.
- The median price of homes for sale increased by 2.5% annually in April, lower than March’s growth rate.
- Homes spent 49 days on the market, which is 17 days longer than last year but still shorter than before the pandemic.
According to Realtor.com®’s April housing data, the housing market continues to face challenges as affordability headwinds persist. The inventory of homes for sale, while higher than last year, is still well below pre-pandemic levels as fewer sellers are opting to list their homes than previous years, largely due to feeling ‘locked in’ by a lower mortgage rate compared to what is obtainable this year. Homes that are for sale are spending more time on the market, and listing price growth has decelerated and is expected to fall compared to the same period last year later this spring. For buyers, decelerating and potentially declining listing prices could be a welcome reprieve, but higher interest rates continue to challenge affordability. Meanwhile, sellers who have built up home equity are better positioned to find their next home in a cooling market, but may need to temper expectations for the sale of their current home.
Inventory Is Still Far From Pre-pandemic Norms as Growth Slows
There were 48.3% more homes for sale in April compared to the same time in 2022. This means that there were 184,000 more homes available to buy on a typical day this past month compared to one year ago. However, the inventory growth rate continued to slow for the second month in a row as fewer potential sellers opted to list their home for sale. This means that there were still fewer homes available to buy on a typical day in April than there were a few years ago.

The total number of homes for sale, including homes that were under contract but not yet sold, increased by 6.3% compared to last year. Growth decelerated from last month’s 9.3% growth rate as fewer potential sellers listed homes. The growth rate in the total number of homes for sale also remains lower than active inventory because there were still fewer homes under contract (pending listings) than there were last year.

The number of homes under contract (pending listings) declined by 22.5% compared to the same time last year. This is slightly lower than March’s 24.2% decline and much improved from December’s peak decline (-36.9% year-over-year).The stabilization and improvement in pending home sales could suggest that the market is making its way out of the trough. In March, while existing home sales dipped, they remained convincingly above the 4 million sales low reached in January.
In March, home selling sentiment as measured by Fannie Mae’s Home Purchase Sentiment Index (HPSI) survey improved. The net share of survey respondents who said now is a good time to sell increased by 8 percentage points compared to the previous month. However, the measure is still 35 percentage points lower than the prior year. However, March’s more positive seller sentiment didn’t translate to more newly listed homes in April. In April, the number of homes newly-listed for sale declined by 21.3% compared to the same time last year. This was a slightly higher rate of decline than March’s 20.1% decrease and new listings remained 29.7% below pre-pandemic 2017 to 2019 levels. A recent Realtor.com survey of sellers revealed that 82% of those looking to both sell and buy a home are feeling ‘locked in’ by previously low mortgage rates.

The number of homes for sale in the 50 largest metro areas in the U.S. increased by 52.7% compared to last year. This was more than the national average. However, inventory in this group of metro areas as a whole is still 46.0% below pre-pandemic levels.
The Southern region saw the most growth in the number of homes for sale, with a 100.3% increase compared to last April. However, home inventory in the South was still 40.6% below pre-pandemic levels. The western region saw the second-most growth, with a 34.7% increase compared to last year. Inventory in the West was 37.4% below pre-pandemic levels. The Midwest and Northeast regions saw slower growth, with 18.9% and 5.2% increases over last April, respectively. Inventory in the Midwest was still 53.9% below pre-pandemic levels, and it was 60.5% below pre-pandemic levels in the Northeast.
No regions saw an improvement in sellers listing homes for sale in April. The South saw listing activity decline least, with newly listed homes down by 13.8% compared to the previous year, while they declined by 33.2% in the West, 21.1% in the Midwest, and 25.5% in the Northeast. In all regions newly-listed homes remained well below the typical levels seen in 2017 to 2019.
Inventory increased in 42 out of 50 of the largest metros compared to last year. Metros which saw the most inventory growth include Austin (+258.0%), Nashville (+192.9%), and Raleigh (+183.2%). However, despite high inventory growth compared to last year, most metros still had a lower level of inventory when compared to pre-pandemic years. In fact, only Austin (+4.3%) saw higher levels of inventory in April compared to typical 2017 to 2019 levels, while in Las Vegas, where inventories were above pre-pandemic level in March, inventories were 8.1% below typical 2017-2019 levels in April.
In April, of the 50 largest metros, only San Antonio saw the number of newly listed homes increase compared to last year, by just 0.4%. Markets which reported large yearly declines included primarily large western metros such as San Diego (-39.4%), San Jose (-39.2%), and Sacramento (-38.3%).
Homes Staying Longer on the Market Than Last Year
The typical home spent 49 days on the market this April which is 17 days longer than the same time last year. Slower inventory turnover was primarily fueling the growth in actively listed homes but homes still spent 12 fewer days on the market this April than they did in the average April from 2017 to 2019.
In the 50 largest metropolitan areas in the United States, the typical home spent 41 days on the market, 15 days more than the previous April. This trend was seen across all regions, with larger metros in the South seeing the greatest increase (+18 days), followed by the West (+16 days), Midwest (+11 days) and Northeast (+9 days). Homes in Western metros were also spending 5 more days on the market than pre-pandemic times, but in all other regions homes were still selling more quickly.
All of the 50 largest metros saw an increase in time on market compared to the previous year. Time on market increased the most in Raleigh (+39 days), Kansas City (+32 days), and Austin (+30 days). Fourteen predominantly western markets saw homes spend more time on the market than typical 2017 to 2019 timing. Kansas City (+21 days), Seattle (+10 days), as well as Los Angeles, San Francisco and Las Vegas (+8 days each), saw the greatest increase in time on market compared to average 2017 to 2019 pacing.

Listing Prices Are Expected to Decline in the Coming Months
The national median list price grew to $430,000 in April, up from $424,000 in March. However, it was still down from a record high of $449,000 in June of last year (-4.4%). This median list price represented a yearly growth rate of only 2.85, which is lower than March’s 6.3% growth rate and the lowest rate of growth since April 2020, in the early months of the COVID-19 pandemic. Last month, we predicted that listing prices are likely to decline relative to the previous year by summer time. However, April’s data showed an acceleration of this trend. At this rate of slowing, listing prices are likely to decline relative to the previous year sometime in May. Meanwhile, the national median sale price shrank on an annual basis for the second month in a row in March.
Higher mortgage rates and home prices compared to April of last year increased the monthly cost of financing 80% of the typical home by roughly $340 (+19.0%) compared to a year ago. This far outpaces recent rent growth (+2.5%) and inflation (+5.0%) but the rate of growth is slowing compared to last month’s 39.3% figure as growth in listing prices and interest rates slowed. Nonetheless, affordability constraints accelerated last summer and while we may see an improvement in affordability compared to the previous year in the coming months, it’s important to note that affordability is expected to continue to create headwinds for many homebuyers this year.

The percentage of homes with price reductions increased from 6.8% in April of last year to 12.2% this year. This share of price reductions, while much higher than last year, has been below typical levels seen in 2017 to 2019 since February. This suggests that while there is a bigger pricing gap between buyers and sellers relative to last year, sellers may be setting their initial asking price to be more in line with buyer expectations than was typical before the pandemic.

In the largest metropolitan areas in the country, the combined annual median list price growth rate for active listings was 7.0%, outpacing the national rate. Midwest metros had the highest growth rate in active listing prices, with an average increase of 11.7% over the past year. Prices in Memphis (+31.4%), Milwaukee (+21.7%), and Kansas City (+21.1%) saw the biggest increases among large metros. However, in each of these metros the mix of inventory changed as larger and more expensive homes were listed for sale in April compared to the previous year. On a price-per-square-foot basis, listing prices only grew by 14.3% in Memphis, 9.7% in Milwaukee, and 11.7% in Kansas City. Nine out of the largest 50 markets saw their median list price decline. The greatest price declines were seen in Austin (-8.8% year-over-year), Las Vegas (-7.1%), and Houston (-4.6%).
Large southern metros saw the largest increase in the percentage of homes with price reductions (+7.1 percentage points), followed by large western metros (+3.7 percentage points). Austin (+16.0percentage points), Phoenix (+11.6 percentage points) and Tampa (+11.6 percentage points) had the largest increases in the percentage of homes with price reductions compared to last year.
April 2023 Regional Statistics (50 Largest Metro Combined Average)
| Region | Active Listing Count YoY | New Listing Count YoY | Median Listing Price YoY | Median Listing Price Per SF YoY | Median Days on Market Y-Y (Days) | Price Reduced Share Y-Y (Percentage Points) |
| Midwest | 18.9% | -21.1% | 11.7% | 5.9% | 11 | +3.0 pp |
| Northeast | 5.2% | -25.5% | 9.3% | 4.5% | 9 | +1.6 pp |
| South | 100.3% | -13.8% | 4.4% | 1.3% | 18 | +7.1 pp |
| West | 34.7% | -33.2% | 3.1% | 0.0% | 16 | +3.7 pp |
April 2023 Regional Statistics vs Pre-Pandemic 2017-2019 (50 Largest Metro Combined Average)
| Region | Active Listing Count vs Pre-Pandemic | New Listing Count vs Pre-Pandemic | Median Listing Price vs Pre-Pandemic | Median Listing Price Per SF vs Pre-Pandemic | Median Days on Market vs Pre-Pandemic (Days) | Price Reduced Share vs Pre-Pandemic (Percentage Points) |
| Midwest | -53.9% | -32.9% | 30.8% | 42.0% | -6 | -5.9 pp |
| Northeast | -60.5% | -37.8% | 35.2% | 48.0% | -12 | -6.1 pp |
| South | -40.6% | -22.0% | 33.7% | 51.3% | -7 | -3.1 pp |
| West | -37.4% | -38.5% | 36.9% | 49.2% | 5 | -3.7 pp |
April 2023 Housing Overview by Top 50 Largest Metros
| Metro Area | Median Listing Price | Median Listing Price YoY | Median Listing Price per Sq. Ft. YoY | Active Listing Count YoY | New Listing Count YoY | Median Days on Market | Median Days on Market Y-Y (Days) | Price Reduced Share | Price Reduced Share Y-Y (Percentage Points) |
| Atlanta-Sandy Springs-Alpharetta, Ga. | $425,000 | 2.4% | -0.5% | 53.6% | -21.8% | 45 | 13 | 11.8% | 4.2 pp |
| Austin-Round Rock-Georgetown, Texas | $570,000 | -8.8% | -10.4% | 258.0% | -10.1% | 45 | 30 | 26.8% | 16.0 pp |
| Baltimore-Columbia-Towson, Md. | $340,000 | 3.1% | 2.6% | 6.5% | -26.3% | 38 | 8 | 9.4% | 2.2 pp |
| Birmingham-Hoover, Ala. | $285,000 | 2.2% | 5.1% | 51.1% | -17.4% | 48 | 16 | 12.1% | 6.2 pp |
| Boston-Cambridge-Newton, Mass.-N.H. | $839,000 | 12.0% | 3.5% | 9.7% | -32.9% | 26 | 10 | 9.2% | 3.2 pp |
| Buffalo-Cheektowaga, N.Y. | $250,000 | 11.1% | 9.4% | 12.8% | -17.1% | 43 | 14 | 5.6% | 2.1 pp |
| Charlotte-Concord-Gastonia, N.C.-S.C. | $425,000 | 2.9% | 0.8% | 85.3% | -15.0% | 40 | 22 | 11.1% | 2.2 pp |
| Chicago-Naperville-Elgin, Ill.-Ind.-Wis. | $369,000 | 5.5% | -3.4% | -4.5% | -31.2% | 39 | 8 | 8.3% | 2.1 pp |
| Cincinnati, Ohio-Ky.-Ind. | $385,000 | 20.3% | 5.7% | 25.1% | -18.7% | 35 | 7 | 7.3% | 2.3 pp |
| Cleveland-Elyria, Ohio | $225,000 | 15.4% | 7.6% | 15.0% | -23.4% | 44 | 7 | 9.4% | 3.6 pp |
| Columbus, Ohio | $385,000 | 16.9% | 5.5% | 20.3% | -24.1% | 24 | 13 | 10.5% | 4.5 pp |
| Dallas-Fort Worth-Arlington, Texas | $460,000 | 4.3% | -1.5% | 130.9% | -5.2% | 40 | 17 | 15.8% | 9.3 pp |
| Denver-Aurora-Lakewood, Colo. | $679,000 | 0.4% | 0.5% | 68.5% | -26.5% | 25 | 20 | 13.6% | 7.0 pp |
| Detroit-Warren-Dearborn, Mich. | $250,000 | 0.0% | -0.6% | 17.5% | -16.6% | 39 | 15 | 11.6% | 1.8 pp |
| Hartford-East Hartford-Middletown, Conn. | $400,000 | 14.3% | 4.0% | -18.5% | -25.7% | 24 | 8 | 4.4% | 0.0 pp |
| Houston-The Woodlands-Sugar Land, Texas | $372,000 | -4.6% | -2.6% | 55.9% | -11.8% | 44 | 8 | 13.3% | 4.2 pp |
| Indianapolis-Carmel-Anderson, Ind. | $330,000 | 10.0% | 4.0% | 62.0% | -1.2% | 39 | 9.5 | 11.6% | 5.4 pp |
| Jacksonville, Fla. | $410,000 | 0.0% | -0.3% | 124.6% | -9.3% | 52 | 23 | 17.0% | 10.4 pp |
| Kansas City, Mo.-Kan. | $460,000 | 21.1% | 11.7% | 50.2% | -21.1% | 71 | 32 | 9.0% | 4.9 pp |
| Las Vegas-Henderson-Paradise, Nev. | $460,000 | -7.1% | -5.9% | 55.4% | -30.9% | 50 | 26 | 17.9% | 7.5 pp |
| Los Angeles-Long Beach-Anaheim, Calif. | $1,100,000 | 12.2% | 4.3% | 17.4% | -29.6% | 44 | 15 | 8.2% | 2.1 pp |
| Louisville/Jefferson County, Ky.-Ind. | $320,000 | 10.3% | 2.2% | 24.5% | -12.0% | 36 | 14 | 11.6% | 4.2 pp |
| Memphis, Tenn.-Miss.-Ark. | $325,000 | 31.7% | 14.3% | 102.6% | -12.6% | 49 | 16 | 14.5% | 7.9 pp |
| Miami-Fort Lauderdale-Pompano Beach, Fla. | $605,000 | 4.8% | 2.6% | 82.0% | -18.1% | 66 | 23 | 12.7% | 7.4 pp |
| Milwaukee-Waukesha, Wis. | $365,000 | 21.7% | 9.7% | -16.9% | -28.7% | 31 | 3 | 6.3% | -0.7 pp |
| Minneapolis-St. Paul-Bloomington, Minn.-Wis. | $450,000 | 7.7% | 16.9% | 14.4% | -20.9% | 37 | 8 | 7.5% | 2.6 pp |
| Nashville-Davidson-Murfreesboro-Franklin, Tenn. | $564,000 | 7.4% | 0.0% | 192.9% | -0.7% | 32 | 21 | 18.4% | 11.0 pp |
| New Orleans-Metairie, La. | $340,000 | -2.6% | 0.1% | 97.7% | -18.8% | 57 | 18 | 19.6% | 8.5 pp |
| New York-Newark-Jersey City, N.Y.-N.J.-Pa. | $700,000 | 6.1% | 8.8% | -2.4% | -24.5% | 54 | 11 | 7.5% | 1.6 pp |
| Oklahoma City, Okla. | $353,000 | 13.3% | 6.6% | 103.7% | -13.2% | 47 | 14 | 14.9% | 9.0 pp |
| Orlando-Kissimmee-Sanford, Fla. | $441,000 | 2.7% | 0.0% | 109.5% | -19.1% | 52 | 21 | 14.1% | 7.9 pp |
| Philadelphia-Camden-Wilmington, Pa.-N.J.-Del.-Md. | $339,000 | 4.4% | 3.3% | 9.9% | -26.9% | 46 | 10 | 11.0% | 3.2 pp |
| Phoenix-Mesa-Chandler, Ariz. | $519,000 | -1.2% | -4.7% | 121.3% | -29.3% | 51 | 27 | 21.4% | 11.6 pp |
| Pittsburgh, Pa. | $225,000 | 0.0% | -3.9% | 26.0% | -18.2% | 47 | 7 | 12.2% | 3.5 pp |
| Portland-Vancouver-Hillsboro, Ore.-Wash. | $629,000 | 7.5% | -1.8% | 51.1% | -28.7% | 37 | 10 | 10.9% | 0.4 pp |
| Providence-Warwick, R.I.-Mass. | $530,000 | 11.6% | 7.3% | 10.5% | -28.4% | 36 | 11 | 5.4% | 1.2 pp |
| Raleigh-Cary, N.C. | $465,000 | -2.4% | -4.7% | 183.2% | -11.4% | 50 | 39 | 9.7% | 4.7 pp |
| Richmond, Va. | $421,000 | 12.9% | 8.5% | 36.2% | -14.7% | 42 | 8 | 6.1% | 3.0 pp |
| Riverside-San Bernardino-Ontario, Calif. | $569,000 | -4.2% | 0.1% | 35.4% | -34.9% | 53 | 24 | 11.1% | 2.7 pp |
| Rochester, N.Y.* | $265,000 | N/A | N/A | -1.5% | -24.9% | 17 | 6 | 5.2% | -0.3 pp |
| Sacramento-Roseville-Folsom, Calif. | $660,000 | 1.7% | -3.8% | -7.6% | -38.3% | 36 | 11 | 8.8% | -1.6 pp |
| San Antonio-New Braunfels, Texas | $354,000 | -1.7% | -2.0% | 138.2% | 0.4% | 56 | 23 | 16.8% | 9.8 pp |
| San Diego-Chula Vista-Carlsbad, Calif. | $1,000,000 | 11.1% | 5.9% | 1.1% | -39.4% | 34 | 11 | 7.2% | 0.6 pp |
| San Francisco-Oakland-Berkeley, Calif. | $1,150,000 | 4.7% | -1.5% | -1.6% | -33.3% | 32 | 9 | 8.3% | 2.9 pp |
| San Jose-Sunnyvale-Santa Clara, Calif. | $1,525,000 | 6.0% | 3.1% | -2.5% | -39.2% | 27 | 11 | 7.0% | 3.3 pp |
| Seattle-Tacoma-Bellevue, Wash. | $825,000 | 3.1% | 4.3% | 43.4% | -35.3% | 31 | 14 | 8.4% | 3.9 pp |
| St. Louis, Mo.-Ill. | $285,000 | 5.6% | 4.5% | 15.1% | -18.9% | 43 | 7 | 9.0% | 2.8 pp |
| Tampa-St. Petersburg-Clearwater, Fla. | $410,000 | -3.1% | -1.7% | 151.7% | -12.8% | 50 | 23 | 18.3% | 11.6 pp |
| Virginia Beach-Norfolk-Newport News, Va.-N.C. | $384,000 | 13.1% | 6.9% | 17.0% | -26.2% | 30 | 9 | 9.2% | 2.6 pp |
| Washington-Arlington-Alexandria, DC-Va.-Md.-W. Va. | $624,000 | 10.4% | 2.1% | 5.1% | -31.8% | 33 | 6 | 7.4% | 1.1 pp |
*Some Rochester listing metrics have been excluded while data is under review.
Subscribe to our mailing list to receive updates and notifications on the latest data and research.